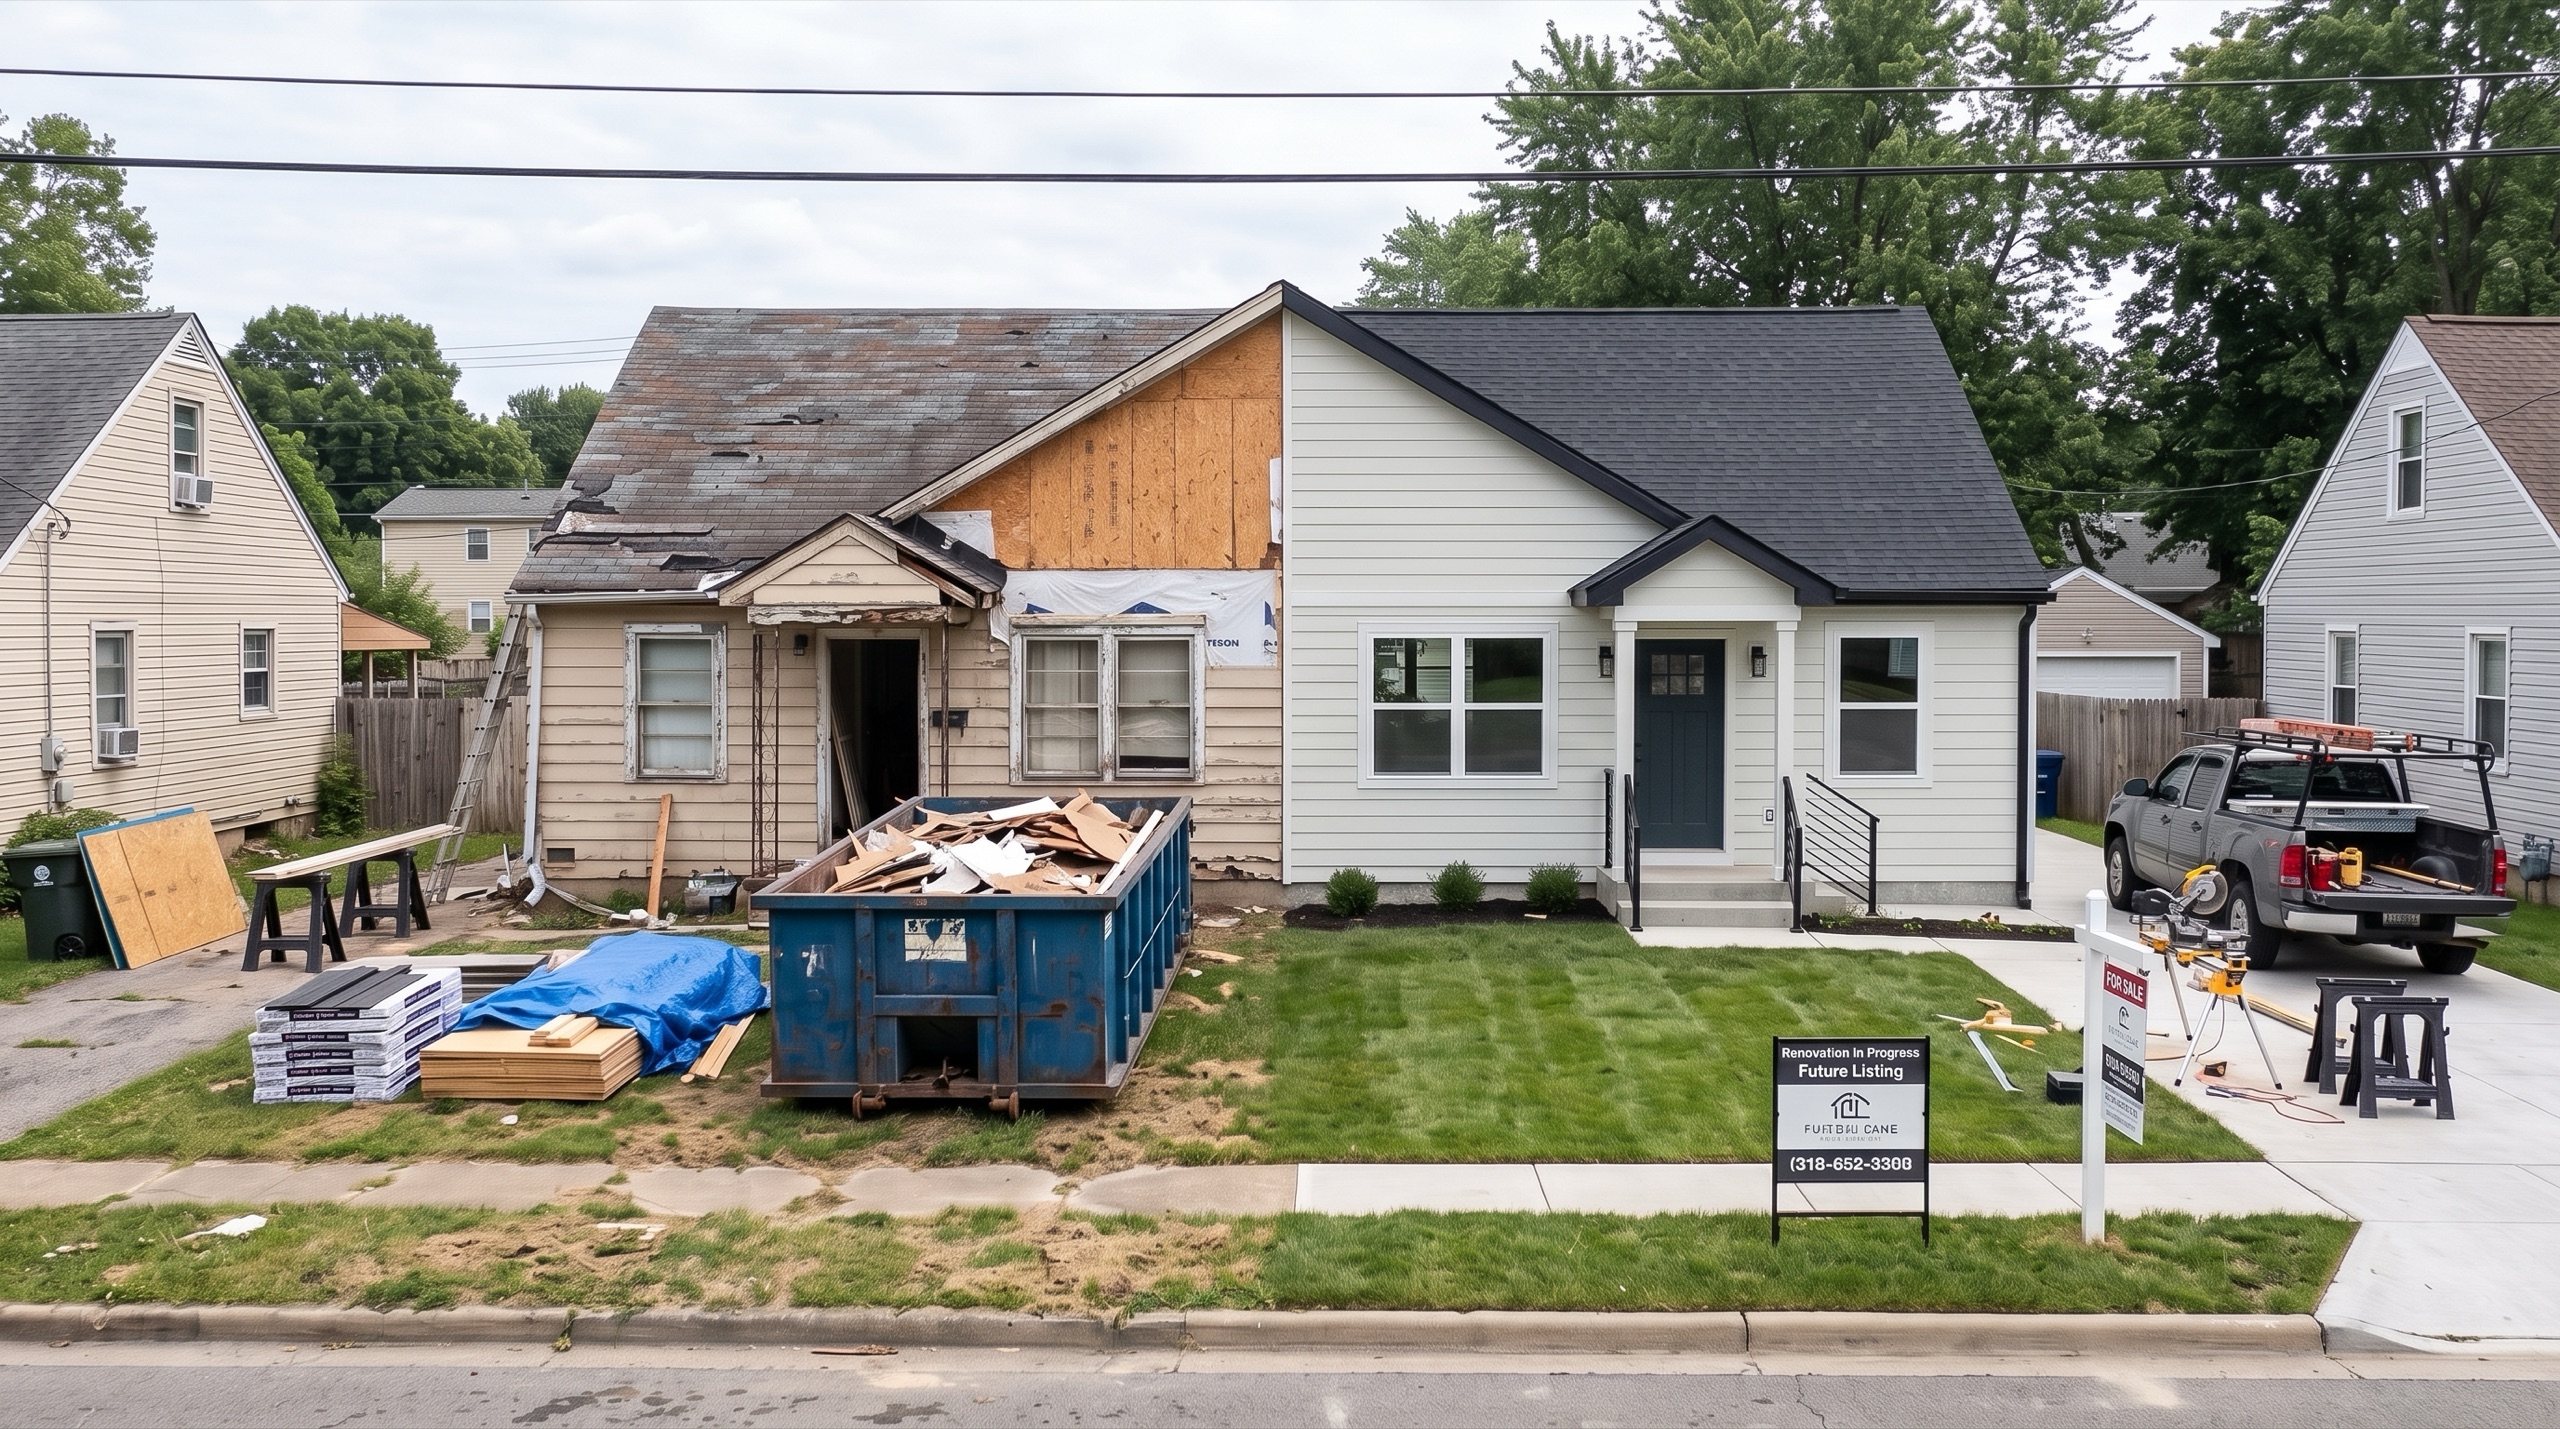
National gross returns on flipped homes are at their lowest point since 2008. Fix and flip investing looks simple from the outside, buy a distressed property, renovate it, sell it for more than you paid. But the investors still generating consistent profits are not doing anything exotic. They are just more disciplined about the fundamentals than everyone else.
At OKOA Capital, we have funded fix and flip projects across a range of markets and price points. What we have learned from reviewing hundreds of deals is that good flips share a common profile. It starts well before the first renovation nail is driven.
Margin Is Made at Acquisition
The most common mistake in fix and flip investing is treating the purchase price as a negotiation outcome rather than a calculated ceiling. Experienced investors work backward from the after-repair value (ARV), the price the renovated property will realistically sell for, and use that number to determine the maximum they can pay.
The industry’s foundational formula is the 70% Rule:
Maximum Allowable Offer = (ARV × 70%) − Estimated Repair Costs
The 30% spread between that number and ARV is not profit. It is the container that holds financing costs, selling costs (agent commissions, closing fees), carrying costs during the renovation, and the investor’s actual net margin. On a typical deal, those costs consume 20 to 25 percent of ARV before a dollar of profit is recognized.
A Q1 2026 survey of active fix and flip investors found the national average acquisition price was 67% of ARV, investors are already buying tighter than the traditional ceiling in response to compressed margins. When a deal does not clear the 70% threshold at purchase, it rarely recovers through execution.
ARV Is Not an Opinion
Everything in the deal math derives from the ARV, which means getting that number right is the most important technical skill in fix and flip underwriting. ARV is determined by closed comparable sales, not active listings, in the same subdivision or within a tight geographic radius, with similar square footage, bedroom count, and vintage.
Pulling comps from too wide a radius, using listed prices instead of closed sales, or assuming renovation quality will push the property above the neighborhood’s established ceiling are the most common valuation errors.
The Full Cost Stack
Most pro formas that come across our desk are incomplete. Investors calculate purchase price plus renovation budget and stop. The full cost stack for a fix and flip includes:
- Loan origination fees and interest during the hold period
- Draw inspection fees
- Property taxes, insurance, and utilities through close
- Buyer and seller closing costs, including agent commissions on the resale (typically 6 to 8% of sale price)
- A contingency reserve of 10 to 15% on top of the renovation budget
Hold time is a direct cost multiplier. Every additional month beyond the target is unplanned cost on a project. A six-month flip that runs to nine months does not just delay profit; it actively erodes it.
Renovation Scope Determines Risk
Not all renovation projects carry the same execution risk. A cosmetic flip is a fundamentally different project than a moderate rehab touching kitchens, baths, and mechanical systems, which is fundamentally different from a full gut. Each tier has a different cost range, timeline, and exposure to mid-project discovery risk.
The most common operational mistake is mis-categorizing a property: calling a moderate rehab a cosmetic job and discovering structural or mechanical issues after walls are opened. Invasive pre-purchase inspection is not optional on anything beyond a light cosmetic scope.
The 2025 Cost vs. Value Report confirms a useful discipline: minor kitchen remodels return over 113% nationally; upscale bathroom renovations return 42%. Over-improving for the neighborhood is a consistent margin leak.
Geography Matters More Than You Think
National averages for fix and flip returns are actively misleading right now. In 2025, the median gross ROI nationally was 25.5% but Pittsburgh-area investors were generating over 100%, while Austin and Dallas investors saw returns in the single digits. The divergence comes down to inventory: supply-constrained markets in the Northeast and Midwest with older housing stock and strong end-buyer demand are performing well; Sun Belt markets that over-absorbed new construction are not.
Good deals are local. The market conditions that govern how quickly a renovated home sells, days on market, and months of supply matter more to a flip’s outcome than almost any renovation decision.
How OKOA Thinks About Fix and Flip Lending
When we evaluate a fix and flip loan, we are underwriting the same variables a disciplined investor should be: a defensible ARV supported by recent closed comps, a realistic renovation budget with a line-item scope of work, and a hold timeline that keeps the cost structure from compressing the margin.
We lend against after-repair value, not current condition which means we can move on distressed assets that conventional financing cannot touch. Our program sizes from $250K to $3M, with leverage up to 70% of ARV, and we typically close in 5 to 10 business days on deals that are ready.
Renovation capital is funded up to 90% of renovation costs through reimbursement-based draws tied to verified completed work. Carrying costs are an eligible use of proceeds, which keeps the investor’s cash working in the project rather than locked up in the carry.
The investors we work best with are operators: people who have a defined buy box, a reliable contractor bench, and think about their exit before they close on the acquisition. They are not trying to manufacture margin through optimistic assumptions, they are demanding it in the purchase price.
OKOA Capital LLC is a private credit firm focused on real estate lending. To get a quick read on a scenario or submit a deal, email [email protected] or submit through the loan intake form at www.okoacapital.com